
← Services

Data Solutions · Case Study

Modernizing electromagnetic spectrum policy analysis.

A scalable Palantir Foundry solution that turns complex policy data and analyst updates into an interactive, decision-ready view of the spectrum.

Platform
Foundry
Focus
Spectrum
Delivery
Prototype

Problem

A government organization relied on a manual, spreadsheet-based process to track spectrum policy initiatives, including frequency ranges, status, responsible organizations, risk, and a growing history of analyst updates. The organization needed a scalable structure and a faster way to identify activity affecting specific portions of the spectrum.
Action

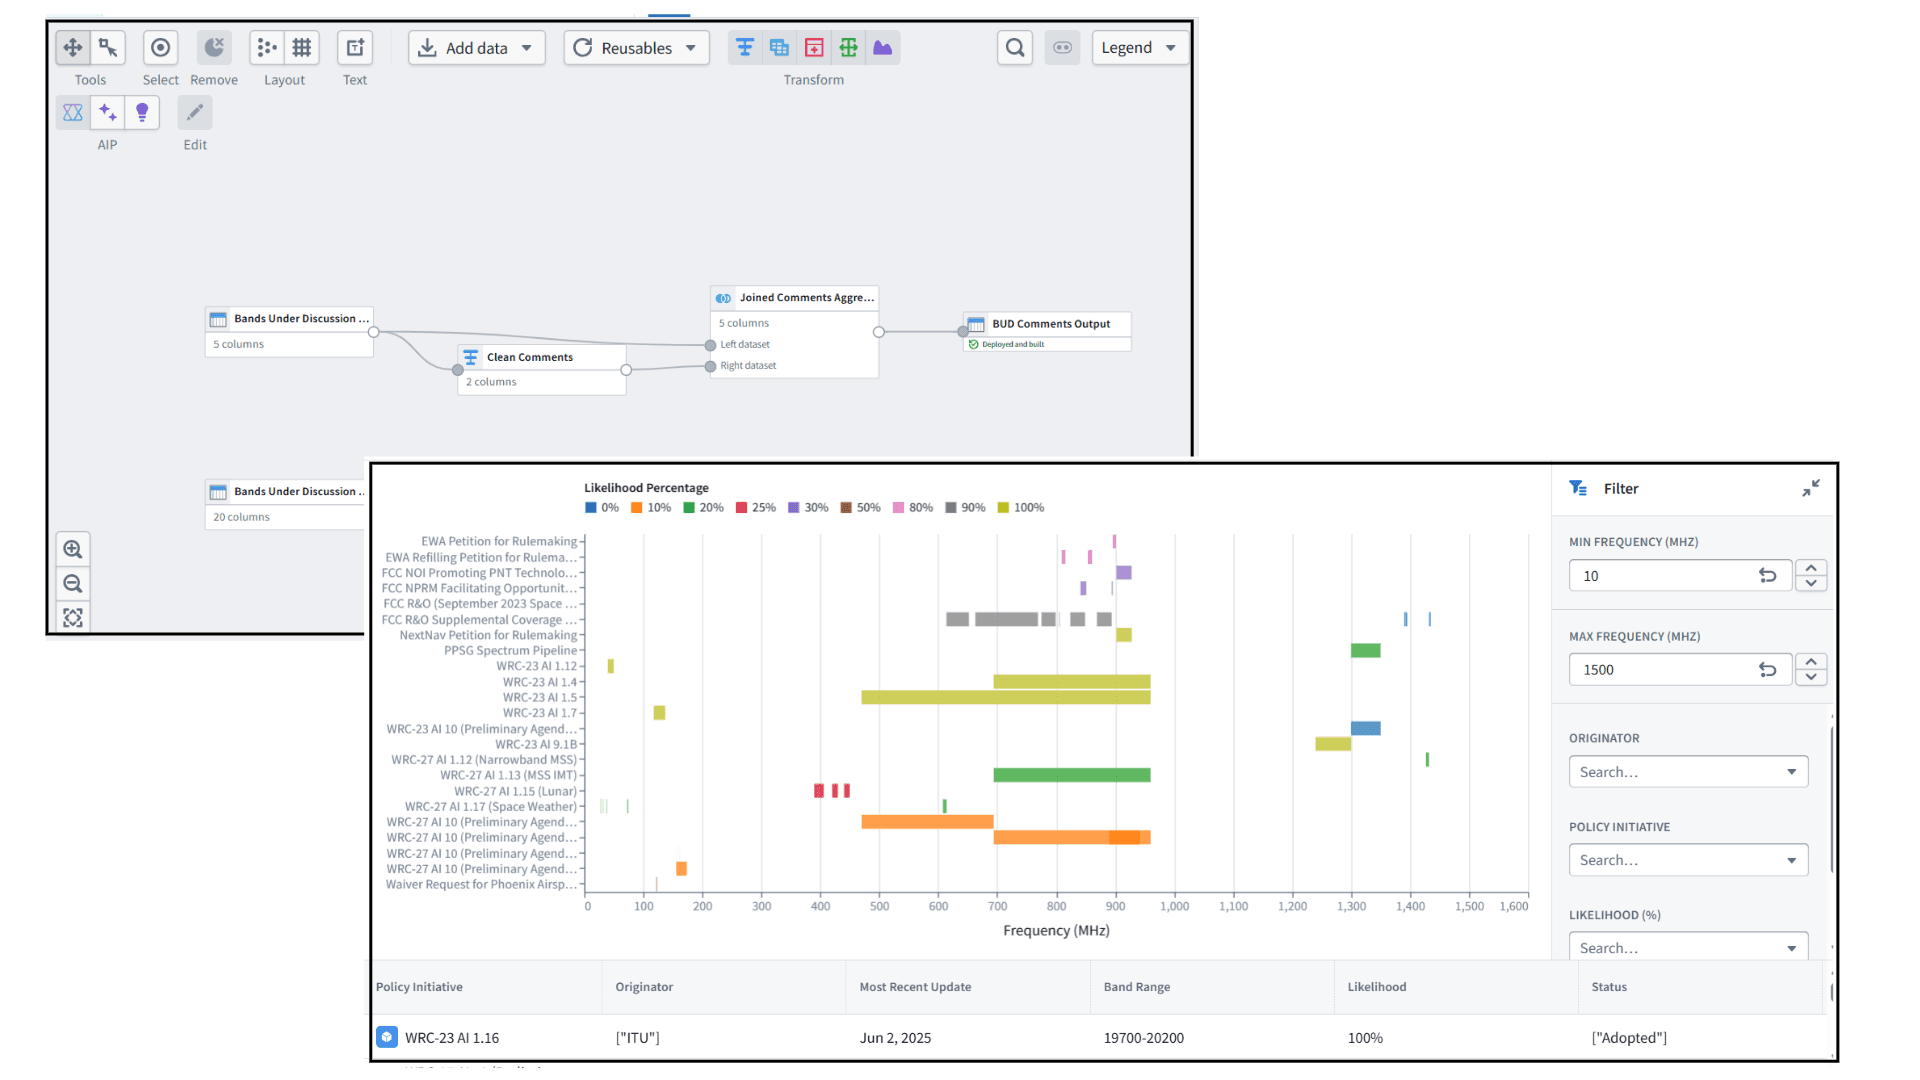
Arama Federal designed and implemented a Foundry solution using Pipeline Builder, Ontology, Workshop, and Vega. The team transformed source data, related initiatives to analyst updates, established data standards and ontology mappings, and created interactive analytical views.

Result

The working prototype replaced static reporting with an interactive spectrum-policy analysis capability and established a repeatable approach for governance, transformation, ontology design, and visualization in Palantir Foundry.

Palantir Foundry data pipeline and interactive spectrum policy dashboard showing initiatives plotted across frequency ranges
Prototype workflow and spectrum visualization. Interface details are shown for capability illustration.

Custom Visualization

See policy activity in its true spectrum context.

A custom Vega view plots each initiative across its actual low-to-high MHz range, with status-based coloring, contextual tooltips, frequency controls, and supporting analytical views.

Analyst Outcomes

  • Explore targeted frequency ranges
  • Identify overlapping policy initiatives
  • Review status and supporting information
  • Extend the model for future dashboards and automation

Build on your data

Turn a manual process into a mission capability.

Talk with our team